Least cost path model
Created a least cost path model using slope, vegetation, and stream data to connect Going-to-the-Sun Road to the Many Glacier Hotel in the most efficient way possible.
Model sequence:
Inputs reclassified to a 0-100 scale on trail accessibility. Slope values were squared to give more difficulty to steeper slopes. Lightly vegetated land cover preferred, while dense vegetation, rocky areas, and cliffs strongly discouraged.
Raster calculator used to combine the 3 attributes of passability.
Distance accumulation function used to create optimized path.
Layout: Used multiple hillshades with layer blends to overlay with imagery for improved depth. Vignette around map borders and proposed path to move focus to important elements.
Programs used: ArcGIS Pro, ArcGIS ModelBuilder.
April 2026.
VIEWSHED ANALYSIS
Viewshed analysis conducted using DEMs & building digital terrain models through TINs.
Process: Started with DEM data from USGS. Created a TIN and imported into ArcScene. Created viewsheds from all viewpoints, with a layout that emphasized the viewpoint with the greatest coverage.
Programs used: ArcGIS Pro, ArcScene.
April 2026.
Example layout we were given by instructors (link)
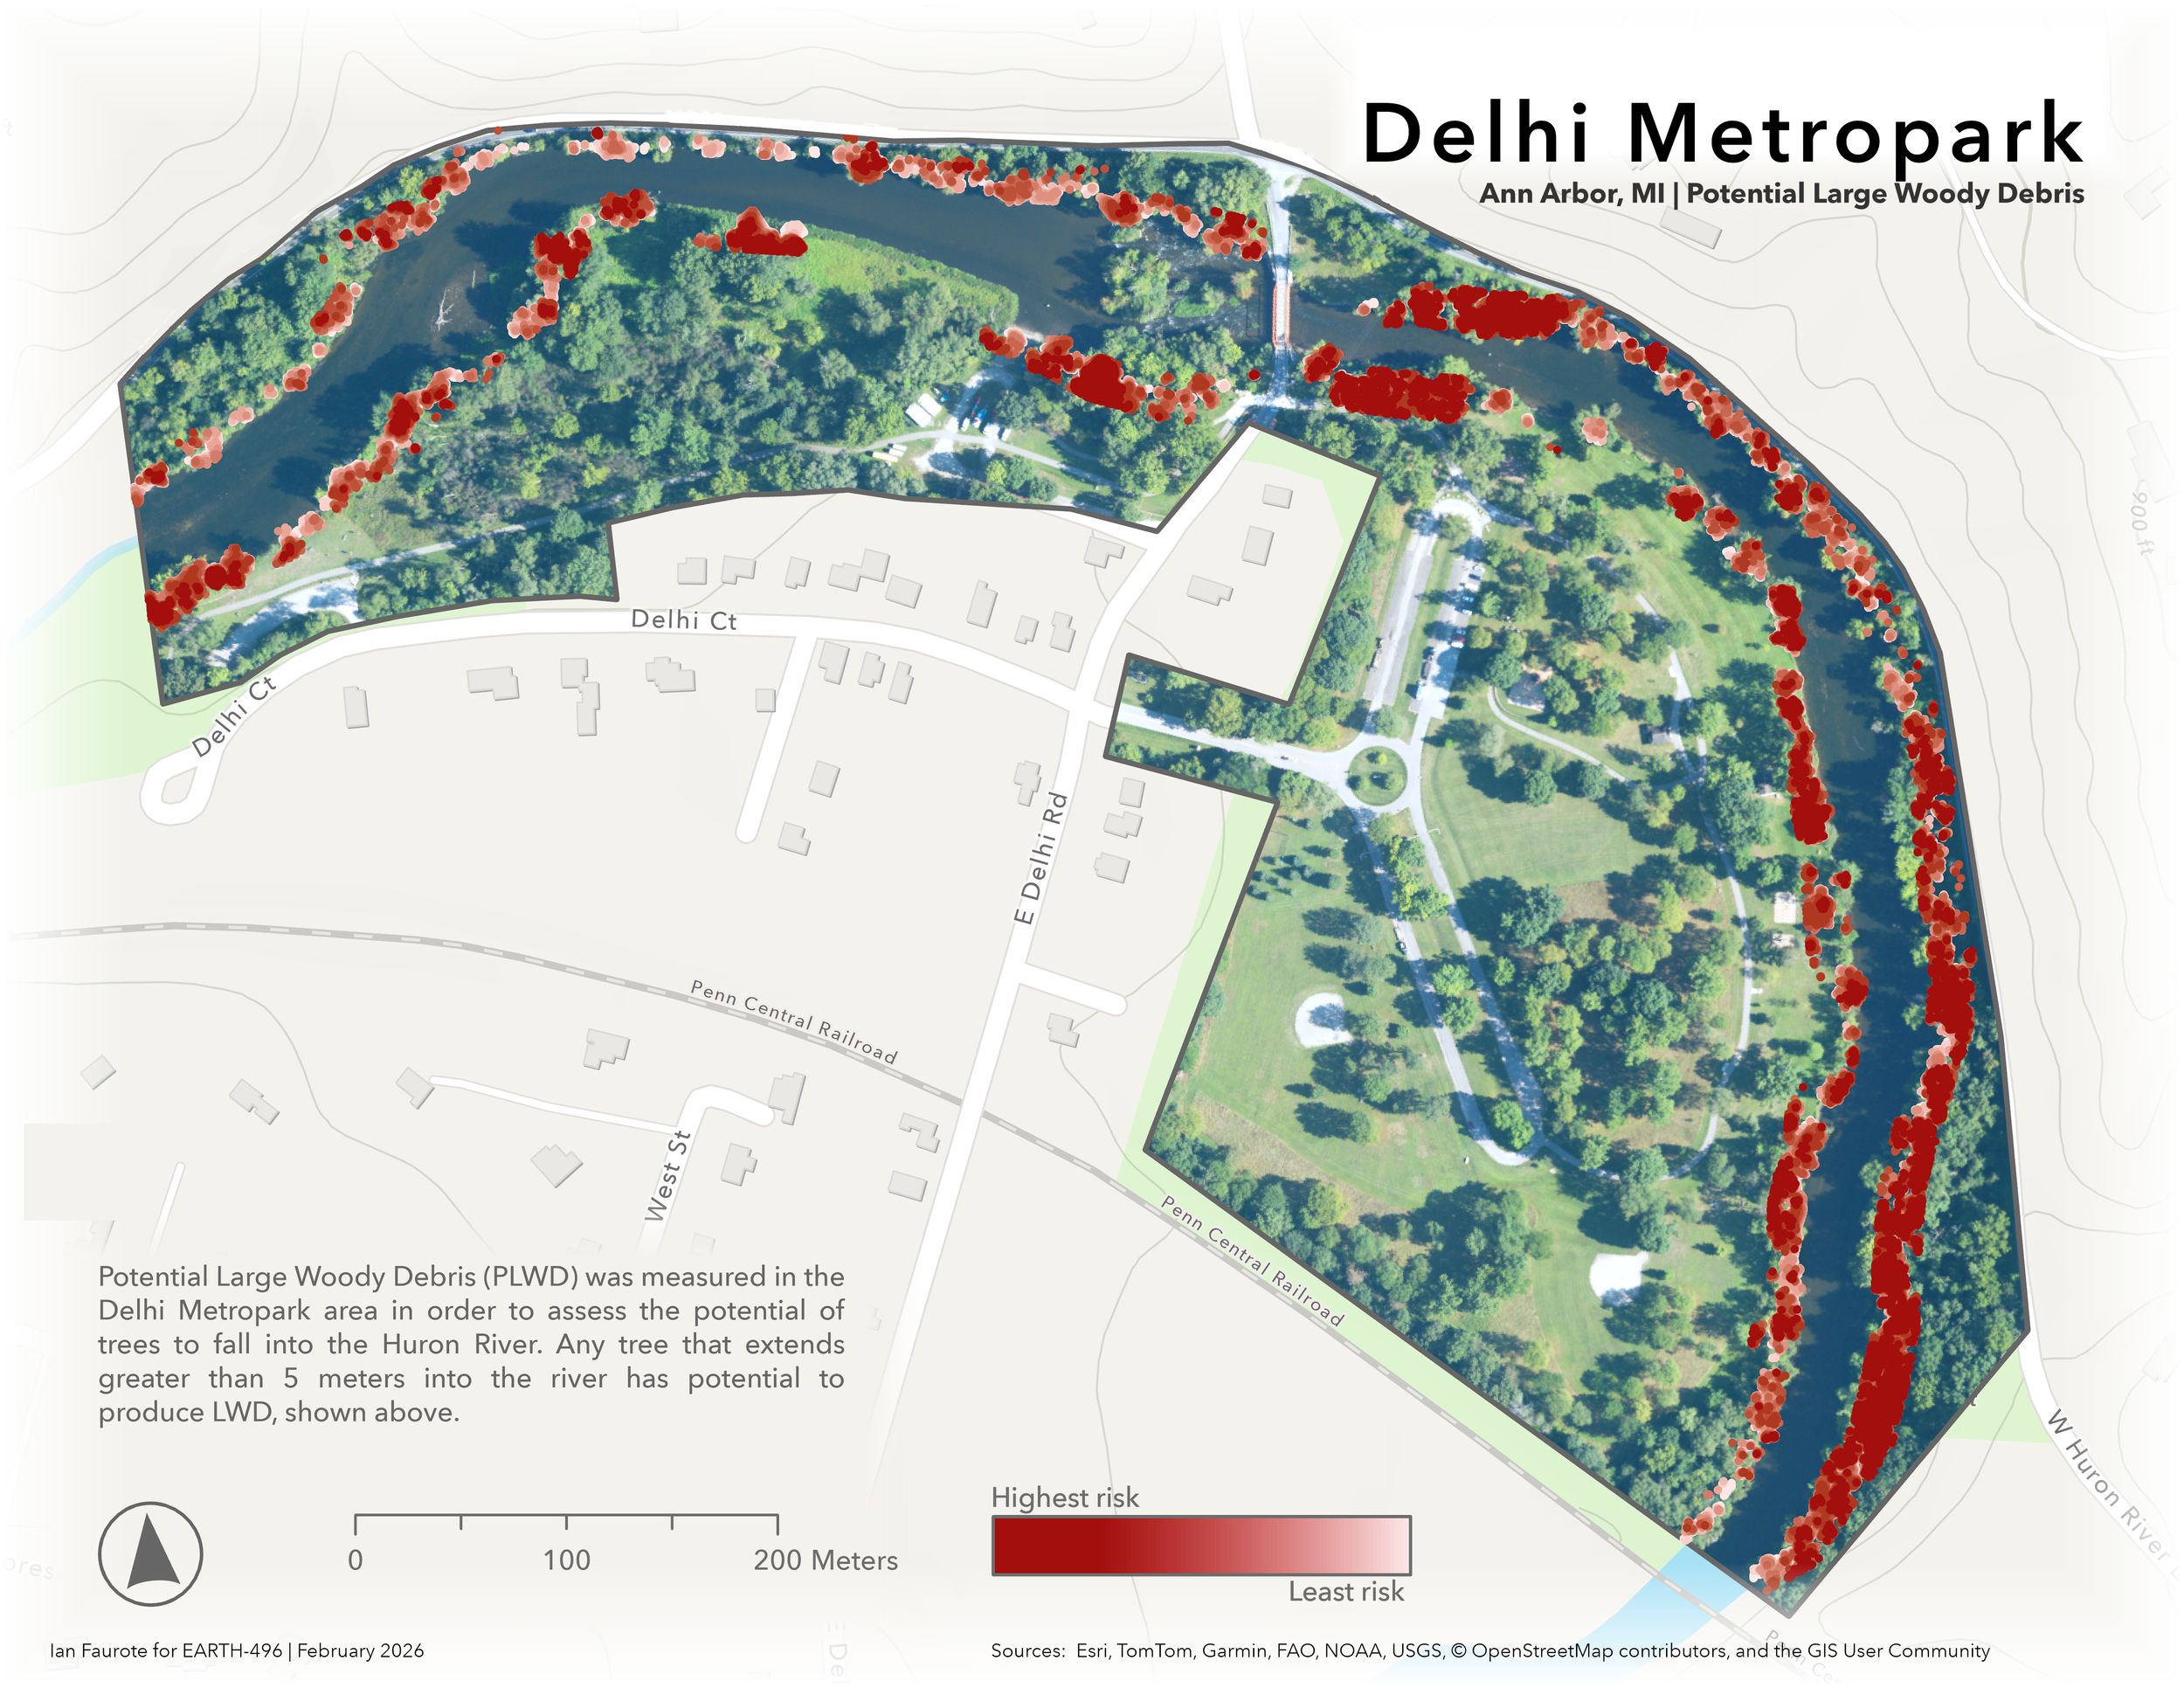
plwd risk analysis
The availability of large tree material (>1 m in length and > 0.1 m in diameter) is called Large Woody Debris (LWD) in geomorphic terminology. The estimate of trees that could fall into the Huron River and provide such debris is called Potential Large Woody Debris (PLWD). This project seeks to create a risk analysis for PLWD.
Process: Used LiDAR data from the NOAA Coastal Data Viewer website, aerial photography from USGS used to identify treetops. Changed LAS filter to only choose treetops, and calculated distance to the river using the Euclidean Distance tool. Distance from the river and tree height was used to calculate the risk of trees to fall into the river. For the layout, I created a polygon to encompass the study area, which was used to clip aerial imagery. Couldn’t find a legend I liked so I created one using a rectangle with gradient fill according to the risk analysis symbology.
Programs used: ArcGIS Pro.
February 2026.